关于水晶单位/综合
General
1. Vibration Modes and Orientation Angles
Regarding the vibration mode of the AT cut, the orientation angle at which the primary coefficient of the frequency temperature characteristics near room temperature reaches zero is indicated in Fig.1
Fig.1 Orientation angle in Z plate artificial crystals
And the mode of thickness shear vibration is shown virtually in Fig.2

Fig.2 Thickness shear vibration
Regarding generally used AT cut crystals, their frequency ranges and frequency coefficients (the relationship between the thickness of crystal plate and oscillation frequency) are shown in Table 1.
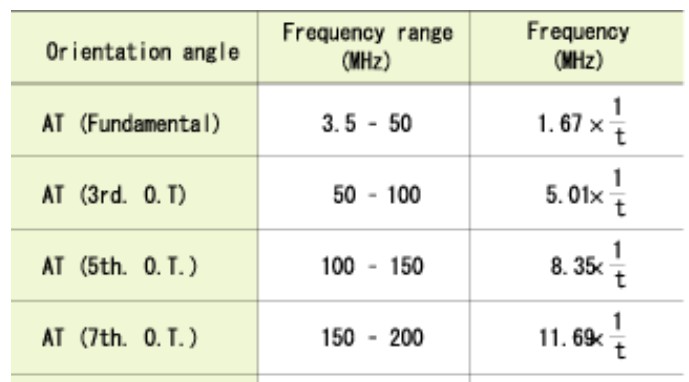
Table 1 Relationship between orientation angle and frequency
2. Frequency-temperature characteristics
The frequency-temperature characteristics of a crystal are categorized into two types according to its shape of curve. One is a tertiary curve and the other is a quadratic curve. The typical frequency-temperature characteristics of AT cuts are shown in Fig.3 and Fig.4, respectively. AT cut crystal units are most widely used because they produce smaller frequency changes in response to temperature changes in the room temperature range.
Fig.3 Example of AT cut frequency stability
3. Equivalent circuit and various constants
The equivalent circuit of quartz crystal near the resonance frequency is represented by the arrangements shown in Fig.5.
R1:Series Resistance
L1: Motional Inductance
C1: Motional Capacitance
C0: Shunt Capacitance
Fig.5 Equivalent circuit of quartz crystals
The admittance locus diagram of a crystal unit near its oscillation frequency and the equivalent circuit of a crystal unit are shown in Fig.6.This chart and figure show the configuration of the equivalent circuit under various circuit conditions and the relationship between oscillation frequency and resistance, etc.Here, we can find the following relationships among the various constants
Fig.6 Admittance locus diagram
